
Where liquidity becomes visible.
Strategy Lab
Sign In
Book-Flow Level Candles are built from raw bid/ask depth and quote data -- every add and pull, at every price level -- revealing liquidity that shaped price without ever printing a trade. Traditional footprint and volume-profile charts can't show this. This can.
This is the actual product, not a mockup -- the real Book-Flow Level Candle chart, rendering real order-flow data.
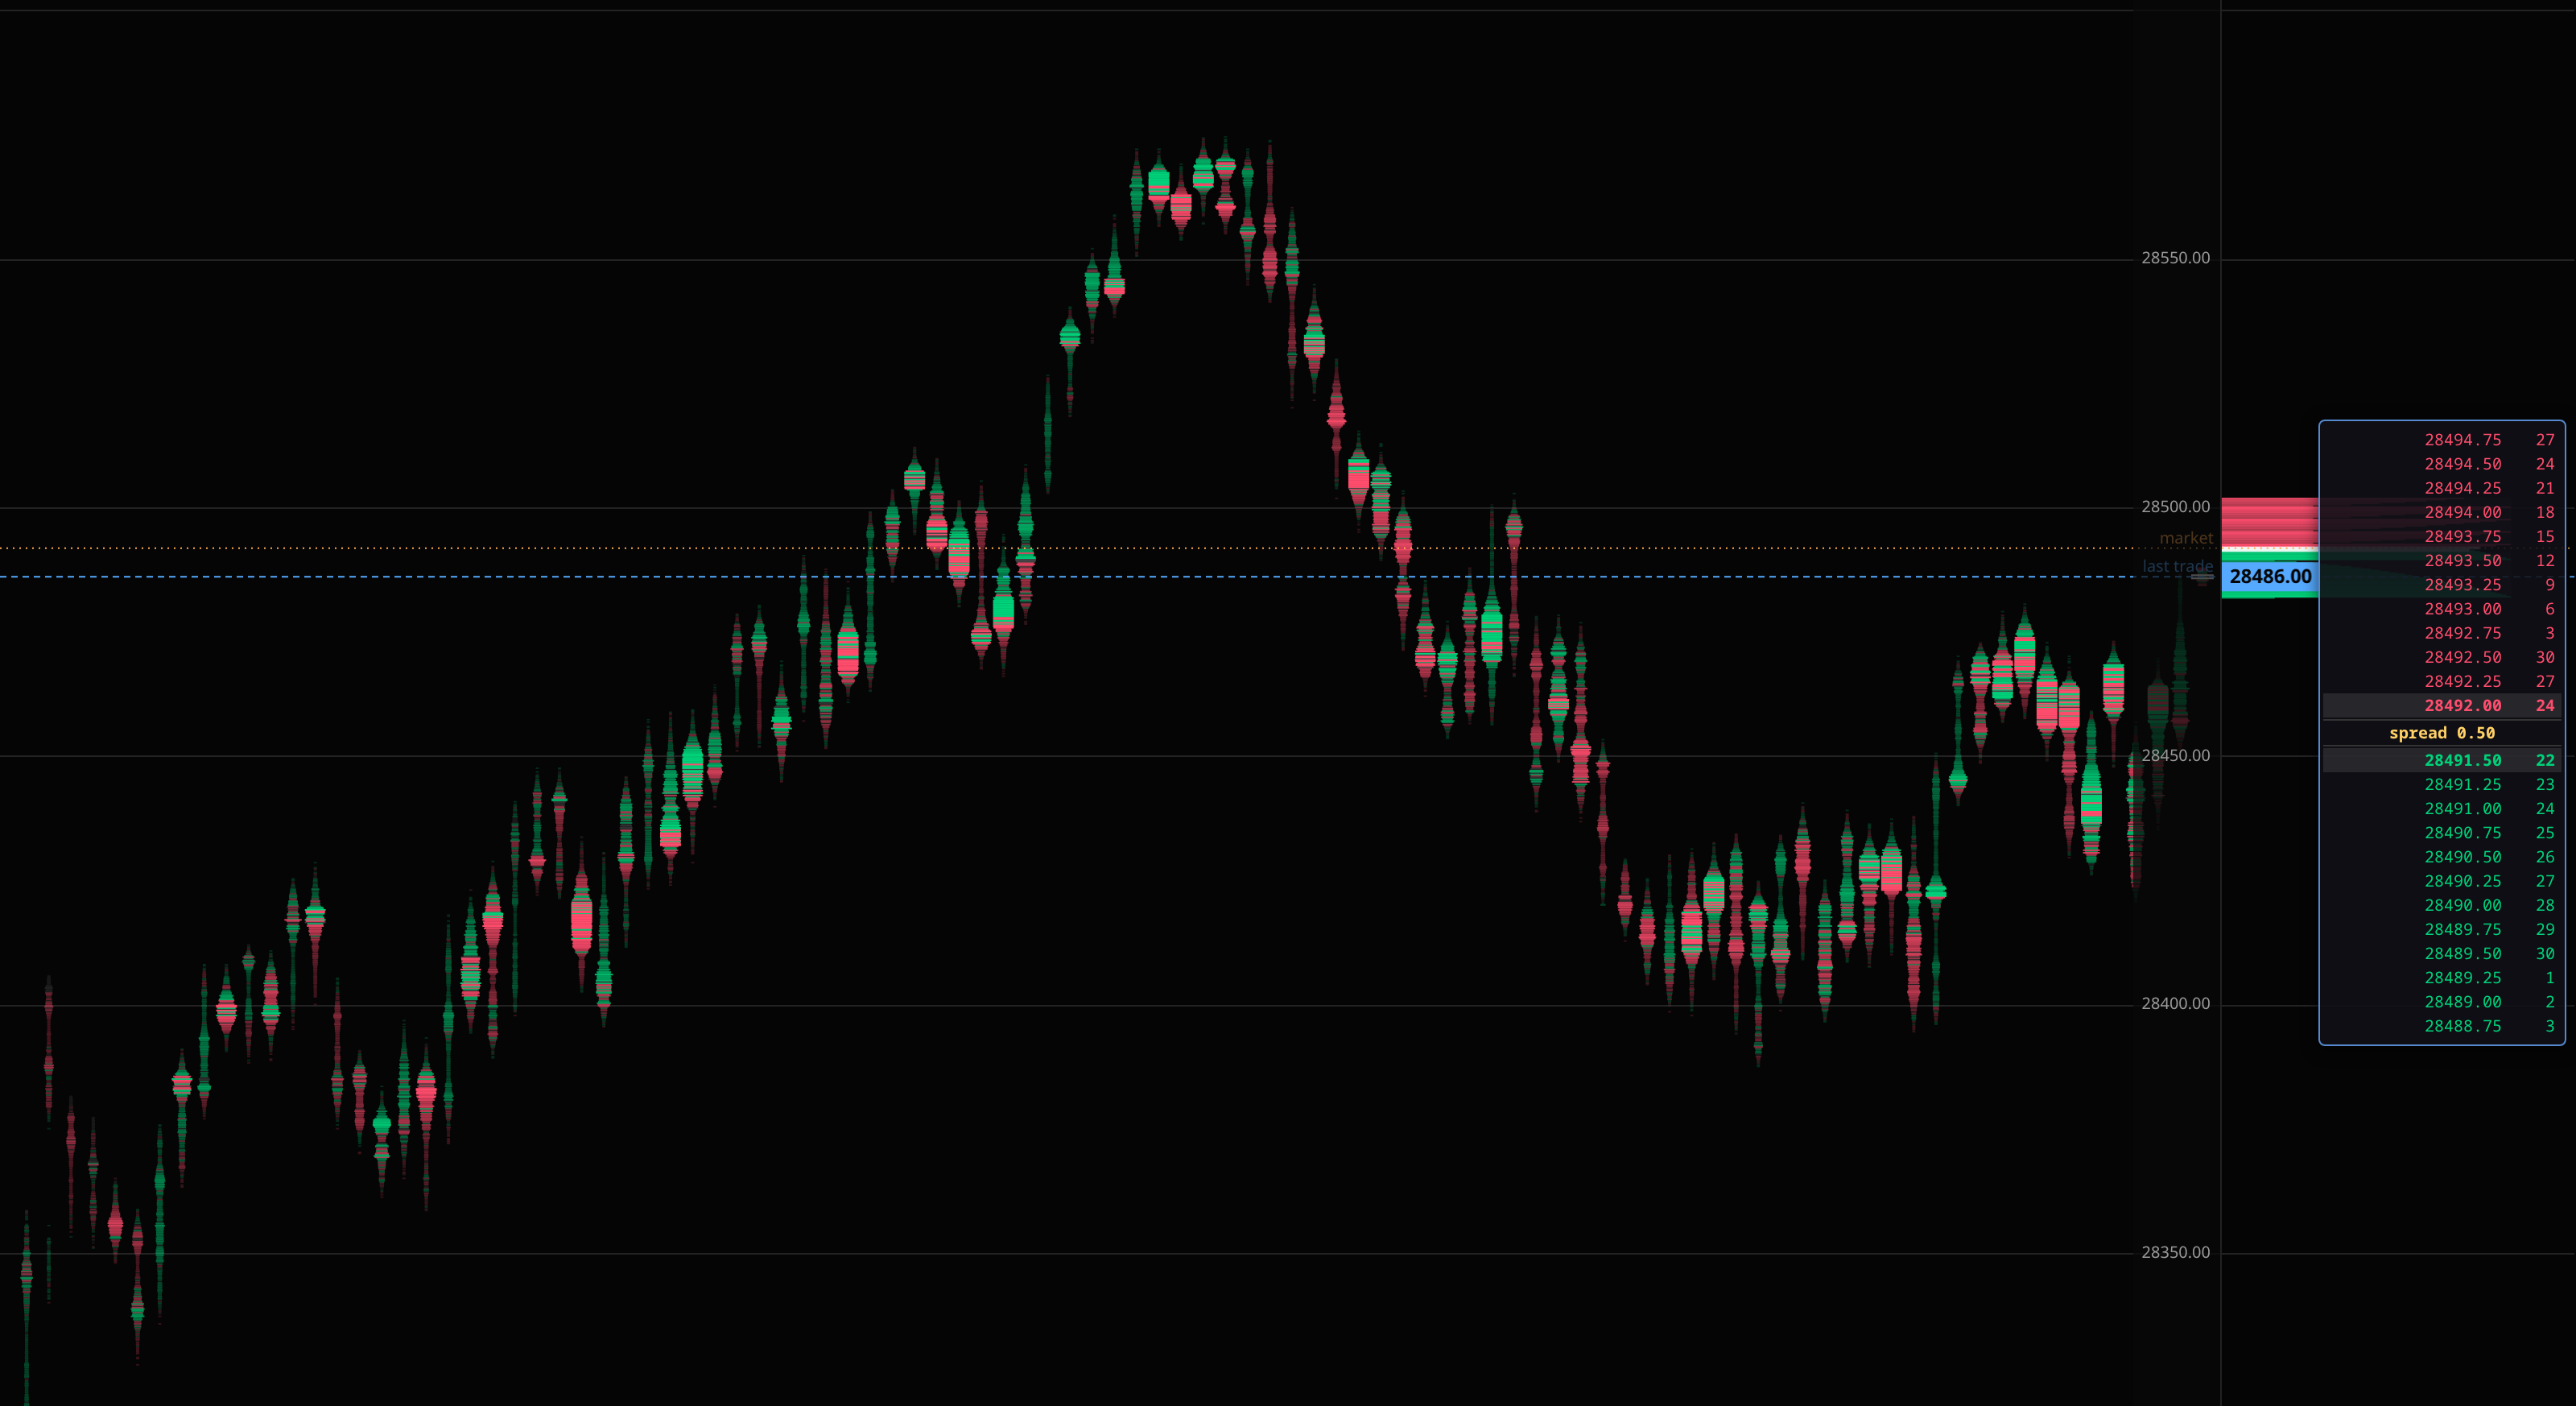
Live view of the Book-Flow Level Candle chart -- bid/ask flow rendered at every price level, every bar.
Ask in plain English. The Strategy Lab turns your idea into a real backtest against live-recorded NQ order-flow data, runs it, and shows you the trades, the equity curve, and the numbers behind it. Nothing is estimated. Nothing is guessed.
Say "go long when order-flow imbalance clears 0.4, exit after fifteen bars" and it runs exactly that. No formula syntax, no scripting, no exporting to a separate tool.
Every test runs against the recorded bid/ask depth and quote data behind Book-Flow Level Candles -- multi-level imbalance, sweep pressure, VPIN, trade delta, regime breaks. The features you can see, you can test.
Results are reported with out-of-sample performance alongside in-sample, and with the number of variations tested. A strategy that only works on the data it was found in will say so. That is the number that matters.
Historical simulation only. Not investment advice, and not a forecast.
A footprint chart -- however detailed -- can only show where trades executed. It has no visibility into resting orders that were placed and then pulled before ever trading. Some of the most information-dense behavior in a market happens exactly there: size building at a level as price approaches it, then vanishing right before contact -- liquidity that shaped the outcome without ever printing a single trade. Because Book-Flow Level Candles are built from raw depth and quote updates rather than trade prints alone, that entire category of behavior becomes visible, at the resolution of every price level, in every bar.
Each bar closes after a fixed amount of executed volume, not a fixed clock interval -- a more honest, apples-to-apples unit of "how much happened," instead of two wildly different market states wearing the same 1-minute label.
Every bid and ask addition and withdrawal at every price level is recorded -- not just where trades printed -- so liquidity that shaped price without ever executing is no longer invisible.
Two bars that look identical on a traditional chart -- same open, same close, same green candle -- can look completely different here, because buying pressure and the other side simply stepping aside are no longer collapsed into one number.
The current resting order book renders on the identical price axis as the historical flow record, so where liquidity concentrated historically and where it's sitting right now are one glance apart, not two separate tools.
This system runs in shadow/research mode. It observes and records real, live market data -- it does not place trades, and nothing here is a signal, a recommendation, or a claim about future returns.
The underlying methodology is built and validated against real production market data, not assembled ad hoc -- the specifics of any model or signal built on top of this data are not disclosed here.
Tell us a bit about yourself. Access is invite-only and granted directly, not through this form.